Embeddings#
Shapelet forest embedding with LR#
This example shows how to compute a shapelet forest embedding for a univariate time series dataset and use a logistic regression model to classify new samples
import matplotlib.pyplot as plt
from sklearn.linear_model import LogisticRegression
from sklearn.model_selection import cross_validate
from sklearn.pipeline import make_pipeline
from wildboar.datasets import load_dataset
from wildboar.ensemble import ShapeletForestEmbedding
random_state = 1234
x, y = load_dataset("GunPoint")
pipe = make_pipeline(
ShapeletForestEmbedding(
n_shapelets=1,
min_shapelet_size=0,
max_shapelet_size=1,
metric="scaled_euclidean",
sparse_output=True,
max_depth=5,
random_state=random_state,
n_jobs=-1,
),
LogisticRegression(solver="newton-cg", random_state=random_state),
)
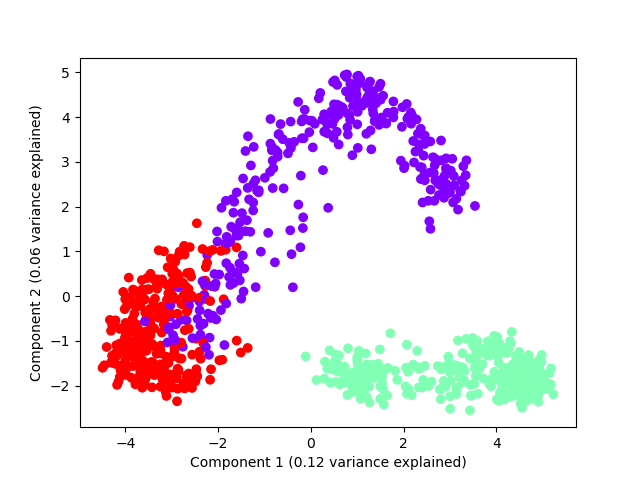
cv = cross_validate(pipe, x, y, cv=5, scoring="accuracy", n_jobs=1)
plt.plot(cv["test_score"], linestyle="", marker="+")
plt.xlabel("CV fold")
plt.ylabel("CV accuracy")
plt.savefig("../fig/sfe_lr.png")
Shapelet forest embedding with PCA#
This example shows how PCA can be used to plot the resulting embedding
import numpy as np
import matplotlib.pyplot as plt
from sklearn.decomposition import PCA
from sklearn.pipeline import make_pipeline
from wildboar.datasets import load_dataset
from wildboar.ensemble import ShapeletForestEmbedding
random_state = 1234
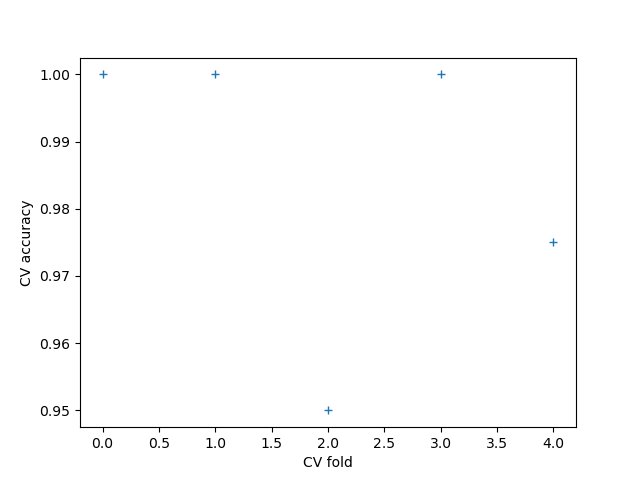
x, y = load_dataset("CBF")
pca = make_pipeline(
ShapeletForestEmbedding(
metric="scaled_euclidean",
sparse_output=False,
max_depth=5,
random_state=random_state,
),
PCA(n_components=2, random_state=random_state),
)
p = pca.fit_transform(x)
var = pca.steps[1][1].explained_variance_ratio_
labels, index = np.unique(y, return_inverse=True)
colors = plt.cm.rainbow(np.linspace(0, 1, len(labels)))
plt.scatter(p[:, 0], p[:, 1], color=colors[index, :])
plt.xlabel("Component 1 (%.2f variance explained)" % var[0])
plt.ylabel("Component 2 (%.2f variance explained)" % var[1])
plt.savefig("fig/sfe_pca.png")