Motif discovery#
[1]:
import numpy as np
import matplotlib.pylab as plt

from wildboar.distance import matrix_profile
from wildboar.annotate import motifs
from wildboar.utils.plot import plot_time_domain
First, we download and load a dataset from the web.
[2]:
x = np.loadtxt("https://drive.google.com/uc?export=download&id=1DYG3rwW_zpd-7lcgYeL0Y2nHtkr2Fi0O")
x = x[20000:30000]
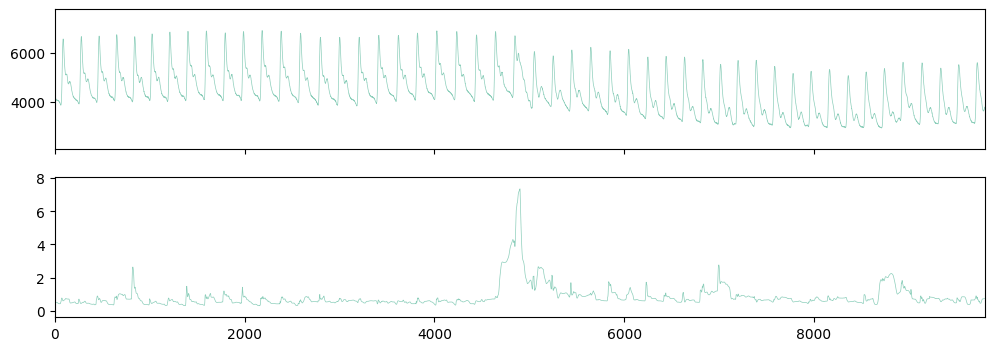
Next, we compute the matrix profile with a window size of 200 timesteps.
[3]:
mp, mpi = matrix_profile(x, window=200, return_index=True)
Next, we plot the time series (top) and the matrix profile (bottom).
[4]:
fig, ax = plt.subplots(nrows=2, figsize=(12, 4), sharex=True)
plot_time_domain(x, ax=ax[0])
plot_time_domain(mp, ax=ax[1])
[4]:
<AxesSubplot: >
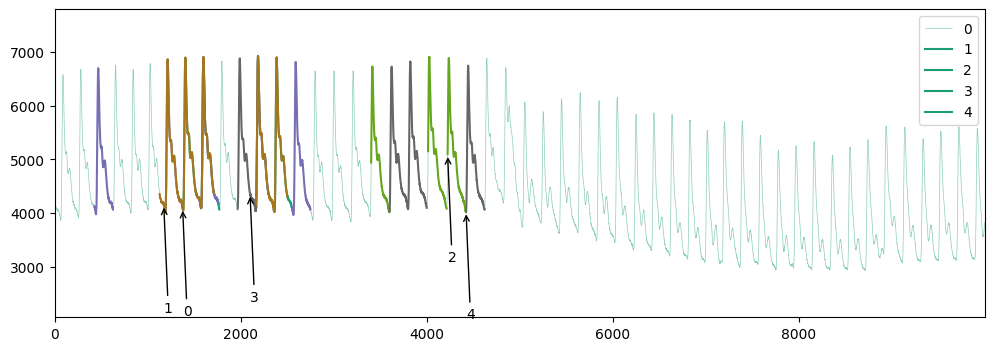
Finally, we find the top motifs.
[13]:
motif_ind = motifs(
    x,
    mp=mp,
    max_distance=0.5,
    max_motif=5,
    min_neighbours=2,
    max_neighbours=5,
    exclude=0.2,
)
And, plot the motifs and their neighbors.
[34]:
fig, ax = plt.subplots(figsize=(12, 4), sharex=True)
plot_time_domain(x, ax=ax)
cmap = plt.get_cmap("Dark2", 5)
for c, ind in enumerate(motif_ind):
    first = ind[0]
    for i in ind:
        ax.plot(np.arange(i, i + 200), x[i : i + 200], color=cmap(c))
    ax.annotate(f"{c}", xy=(first, x[first]), xytext=(first, x[first] - 2000), arrowprops=dict(arrowstyle="->", connectionstyle="arc3"))
[34]:
<matplotlib.legend.Legend at 0x7f382caa7d60>
[ ]:
[ ]: