Segmentation#
[1]:
import numpy as np
import matplotlib.pylab as plt

from wildboar import annotate
from wildboar.utils.plot import plot_time_domain
First, we download a dataset.
[2]:
x = np.loadtxt("https://drive.google.com/uc?export=download&id=1DYG3rwW_zpd-7lcgYeL0Y2nHtkr2Fi0O")
x = x[20000:30000]
Next, we find the change points that segment the time series.
[3]:
segments = annotate.segment(x=x, n_segments=3, window=200)
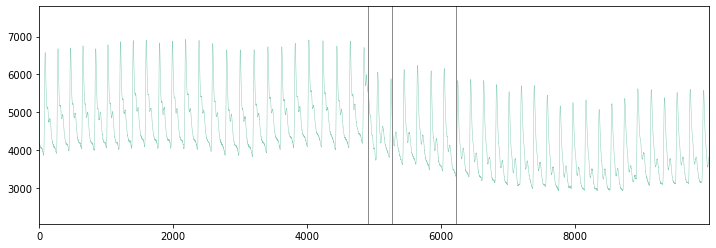
Finally, we plot the change points that segment the time series.
[4]:
fig, ax = plt.subplots(figsize=(12, 4), sharex=True)
plot_time_domain(x, ax=ax)

for segment in segments:
    ax.axvspan(segment, segment + 1, 0, 1, color="gray", alpha=0.9, linestyle="dashed")