Preprocessing#
The datasets module contains support for a selection of state-less sample-wise preprocessing functions.
[1]:
import numpy as np
import wildboar as wb
import matplotlib.pylab as plt
from wildboar.datasets import load_dataset
from wildboar.datasets import preprocess
Currently, wildboar support the following preprocessing functions:
[2]:
preprocess._PREPROCESS.keys()
[2]:
dict_keys(['standardize', 'normalize', 'minmax_scale', 'maxabs_scale', 'truncate'])
To exemplify, we can load a dataset. Note that the GunPoint dataset in the wildboar/ucr repository has already been standardized with zero mean and unit standard deviation.
[3]:
x, y = load_dataset("GunPoint")
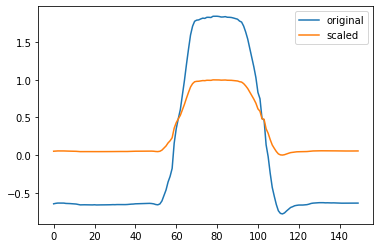
Instead, in the example we preprocess the samples to be in the range min, max. By default, the ranges form minmax_scale is set to 0and 1.
[4]:
x_standardized = preprocess.minmax_scale(x)
[5]:
plt.plot(x[0])
plt.plot(x_standardized[0])
plt.legend(["original", "scaled"])
[5]:
<matplotlib.legend.Legend at 0x7f9bf87ed430>
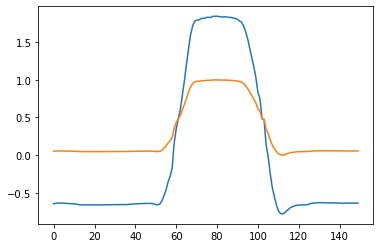
We can also supply the preproccessing function directly to the load_dataset function using the preprocess parameter.
[6]:
x_standardized, y = load_dataset("GunPoint", preprocess=preprocess.minmax_scale)
plt.plot(x[0])
plt.plot(x_standardized[0])
[6]:
[<matplotlib.lines.Line2D at 0x7f9c4898c2e0>]
Finally, we can specify the preprocess argument as a string. The names are given by the _PREPROCESS.keys().
[7]:
x_standardized, y = load_dataset("GunPoint", preprocess="minmax_scale")
Truncate#
Sometimes, when dealing with multivariate time series, we have a data where each sample is desribed by unequal-length dimensions.
[8]:
x, y = load_dataset("SpokenArabicDigits", repository="wildboar/ucrmts")
x = x[0:25, :3, :] # we only retain the first 3 dimensions
We can use wildboar.iseos (is end-of-sequence) to determine if an index has the end-of-sequence value. Then we find the first index of that is end-of-sequence and, for each dimension, plot the length of that dimensions.
[9]:
def plot_dim_len(x):
eos = wb.iseos(x).argmax(axis=2)
fig, ax = plt.subplots(nrows=eos.shape[1], figsize=(10, 6))
cmap = plt.get_cmap(lut=eos.shape[1])
for dim in range(eos.shape[1]):
eos[eos[:, dim] == 0] = x.shape[-1] # if eos == n_timestep
ax[dim].scatter(
np.arange(eos.shape[0]),
eos[:, dim],
label="dim %d" % dim,
marker="x",
color=cmap(dim),
)
fig.legend(loc="lower left")
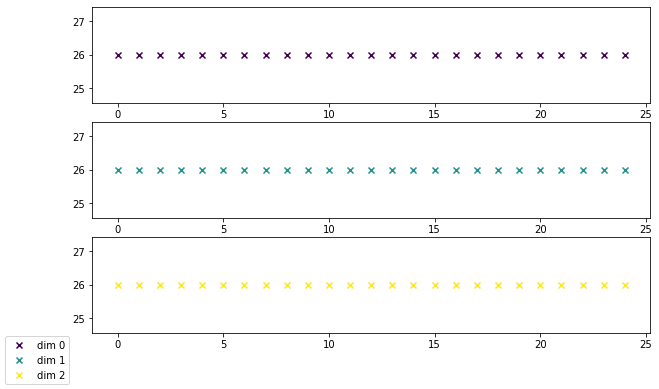
plot_dim_len(x)
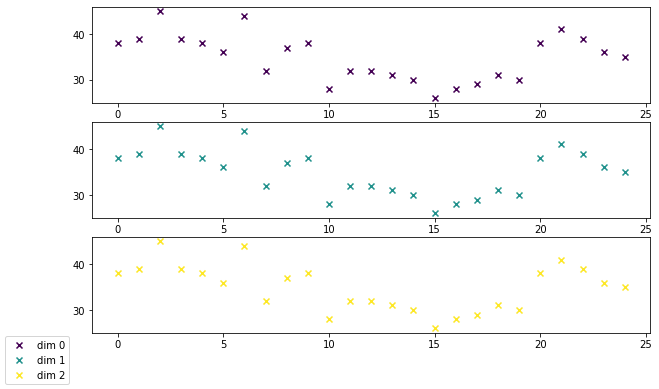
Since many algorithms in wildboar only support dimensions and samples of uniform length, we can preprocess the time series using the truncate function. The returned time series have uniform length. Please note that truncating is very crude and result in data loss.
[10]:
plot_dim_len(preprocess.truncate(x))